Download the database (.xls) – Download the entire Chartbook (.pdf)


Sources and References
Sources:
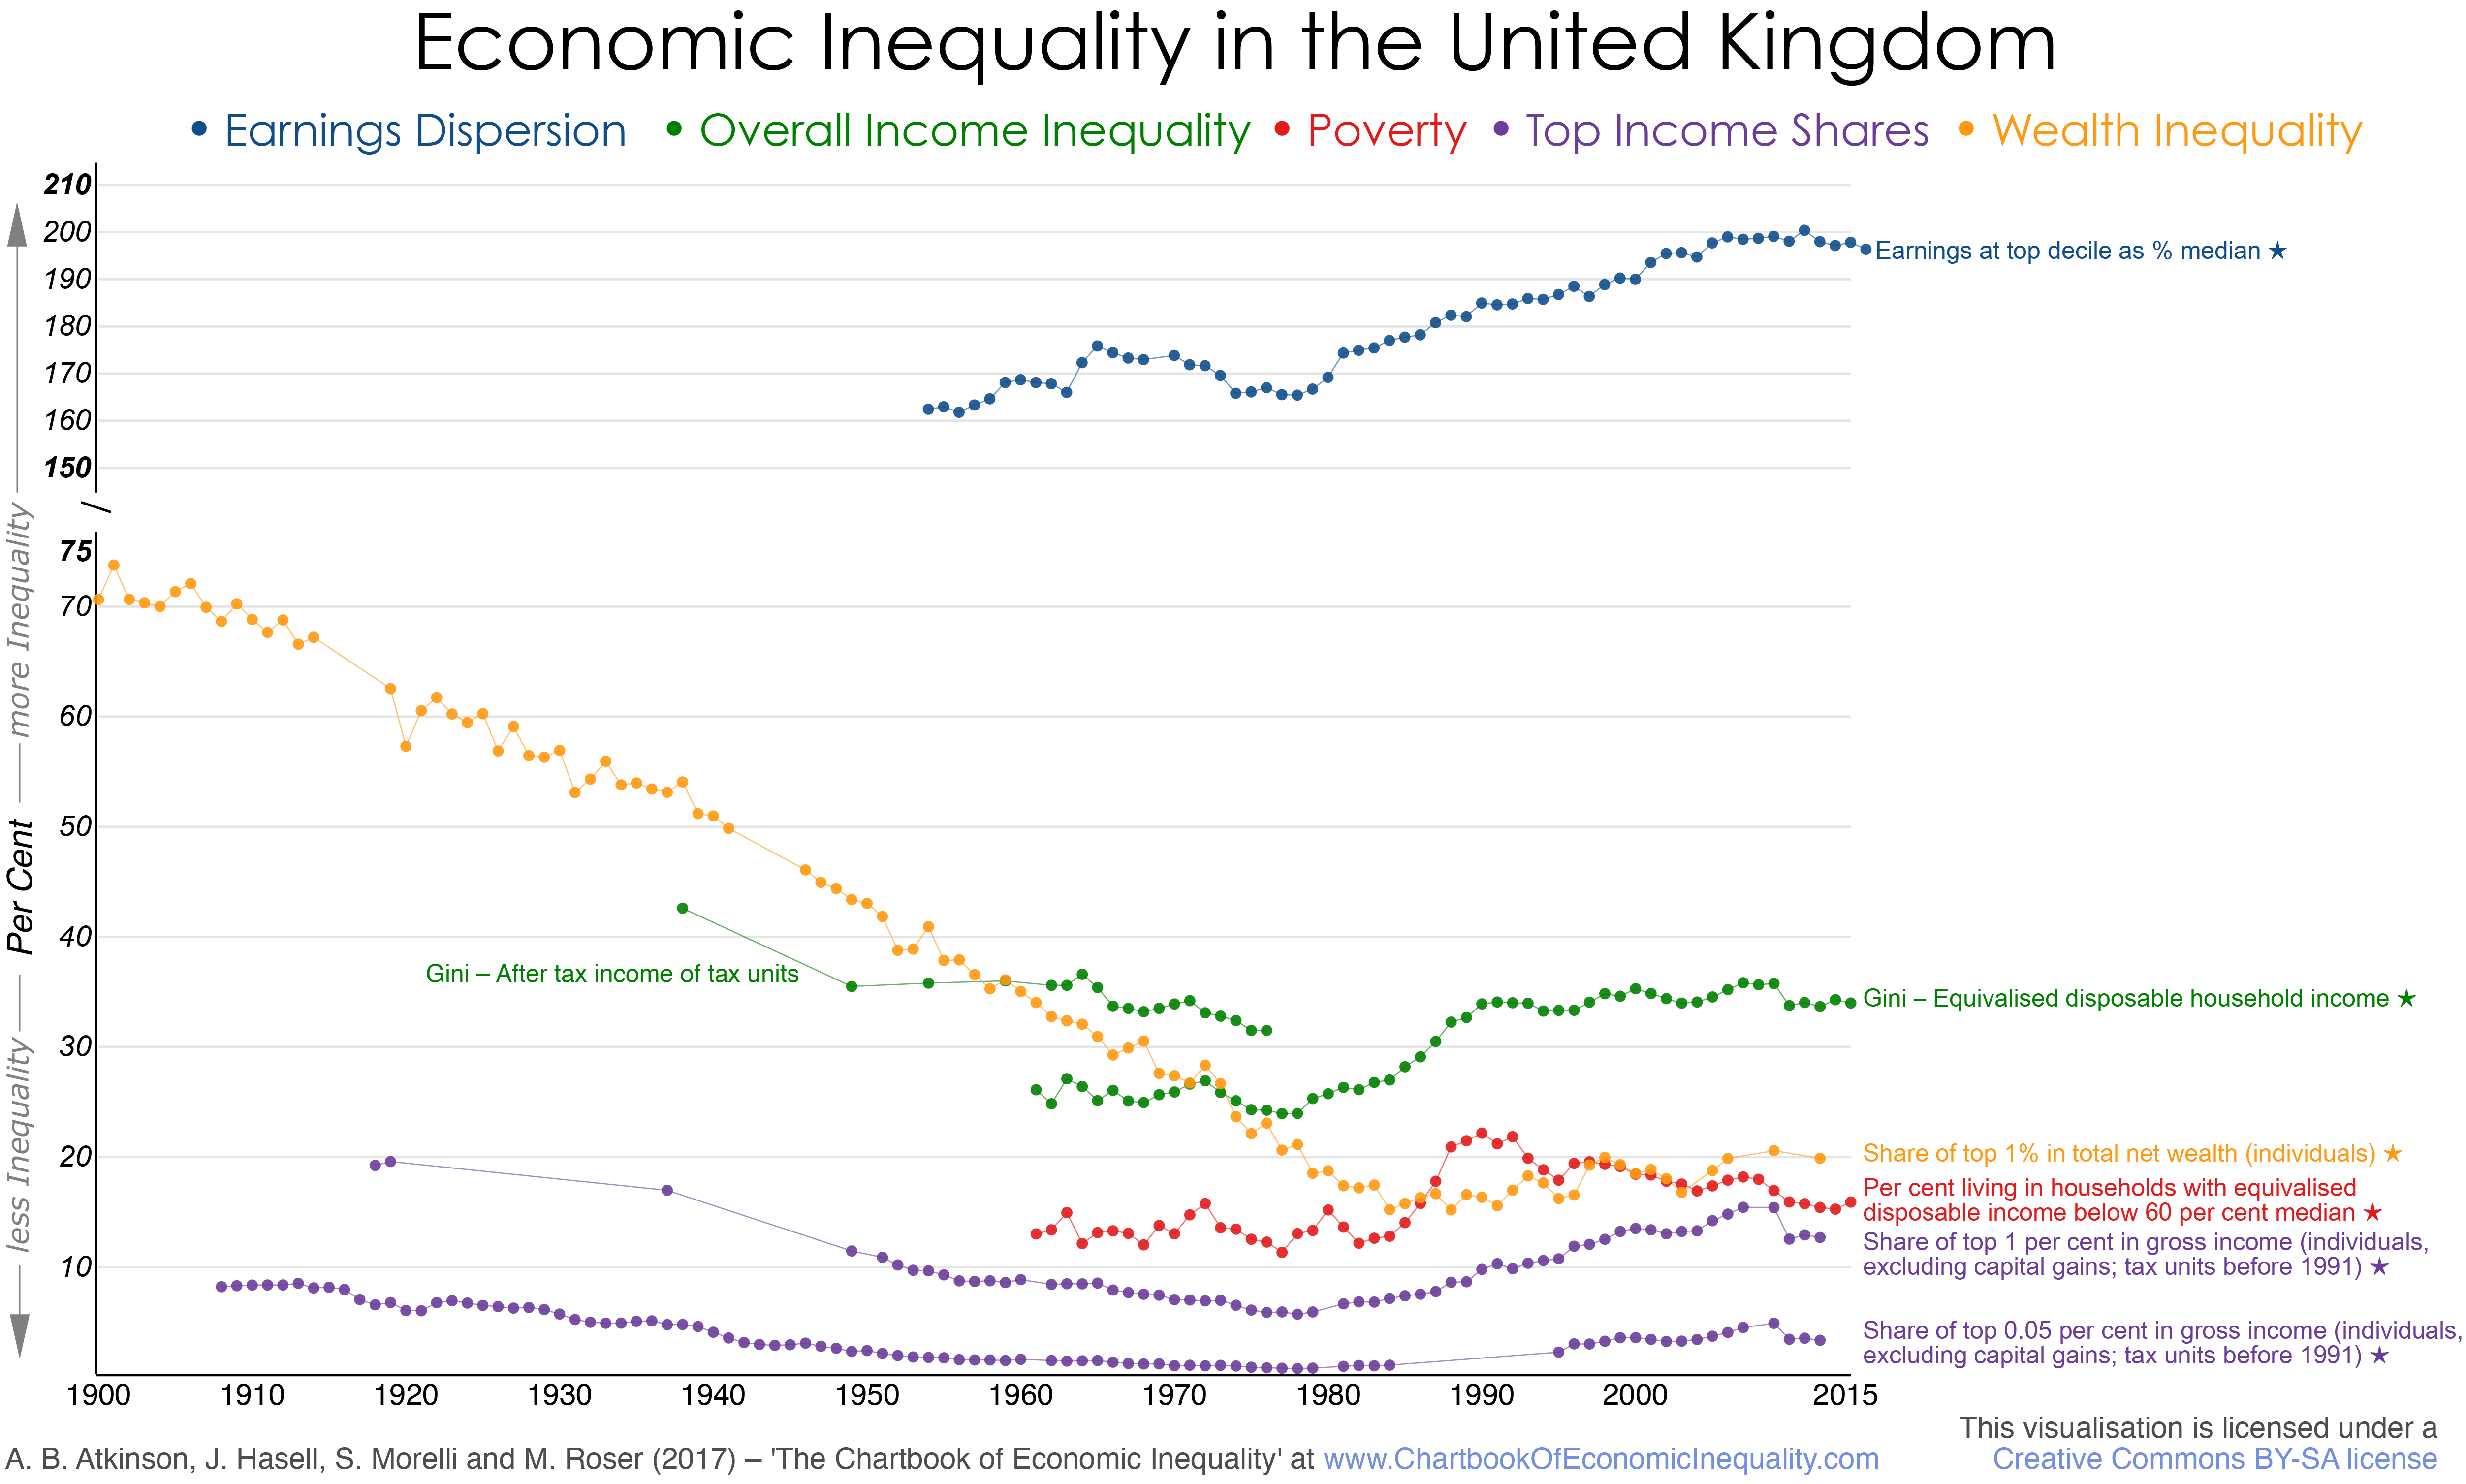
Overall inequality: Series 1: Gini coefficient of equivalised (modified OECD scale) disposable household income for all persons in the United Kingdom (Great Britain up to 2001/2) from Institute for Fiscal Studies: Living Standards, Inequality and Poverty Spreadsheet (before housing costs deducted data (BHC)), downloaded 19 March 2017; the data are from the Family Expenditure Survey from 1961 up to financial year 1993/4 (calendar years up to 1992), thereafter from the Family Resources Survey. Series 2: Gini coefficient of after tax income, not equivalised, among tax units (“Blue Book series”) from Atkinson and Micklewright, 1992, Table BI1 (figure for 1938 from Royal Commission on the Distribution of Income and Wealth, 1979, page 23);
Top income shares: Share of top 1 per cent and top 0.05 per cent in total gross income from the WID.world (excluding capital gains), based on the work of Atkinson (2007) and updated by the same author. Note that the UK experienced a change in the tax base as the taxation system moved from family to individual base in 1990.
Poverty measures: Percentage of individuals in households with equivalised (modified OECD-scale) disposable income below 60 per cent of the median in the United Kingdom (Great Britain up to 2001/2) from Institute for Fiscal Studies: Living Standards, Inequality and Poverty Spreadsheet (before housing costs deducted data (BHC)), downloaded 19 March 2017; the data are from the Family Expenditure Survey from 1961 up to financial year 1993/4 (calendar years up to 1992), thereafter from the Family Resources Survey.
Dispersion of earnings: Earnings at top decile as percentage of median earnings from Annual Survey of Hours and Earnings, ASHE 1997 to 2016 selected estimates, Table 5, ONS (downladed 19 March 2017), covering all full-time workers on adult rates whose pay for the survey period was not affected by absence, linked backwards to take account of changes in methodology in 2011, 2006 and 2004, linked at 1997 to the data from the New Earnings Survey (NES) from Atkinson (2008, Table S.4), taking the series back to 1968 (when the NES began); again linked at 1968 backwards to the income tax data (Schedule E earnings) from Atkinson (2008, Table S.7).
Wealth inequality: Share of top 1 per cent of individuals in total personal net wealth from WID.world based on the work of Alvaredo, Atkinson and Morelli (2016), which makes allowance for wealth of the excluded population; series interpolated where no wealth estimates using share of top 1 per cent of estates as interpolating variable based on estimated relationship.
References:
- Alvaredo, F, Atkinson, A B and Morelli, S, 2016, “Top wealth shares in the UK over more than a century”, CEPR Discussion Paper, N. 11759.
- Atkinson, A B, 2007, “The Distribution of Top Incomes in the United Kingdom 1908-2000” in A B Atkinson and T Piketty, editors, Top incomes over the twentieth century, Oxford University Press, Oxford.
- Atkinson, A B, 2008, The changing distribution of earnings in OECD countries, Oxford University Press, Oxford.
- Atkinson, A B, Gordon, J P F and Harrison, A J, 1989, “Trends in the shares of top wealth-holders in Britain, 1923-1981”, Oxford Bulletin of Economics and Statistics, vol 51: 315-332.
- Atkinson, A B and Micklewright, J, 1992, Economic transformation in Eastern Europe and the distribution of income, Cambridge University Press, Cambridge.
- Royal Commission on the Distribution of Income and Wealth, 1979, Report No. 7, Fourth report on the Standing Reference, Cmnd.7595, HMSO, London.