Download the database (.xls) – Download the entire Chartbook (.pdf)


Sources and References
Sources:
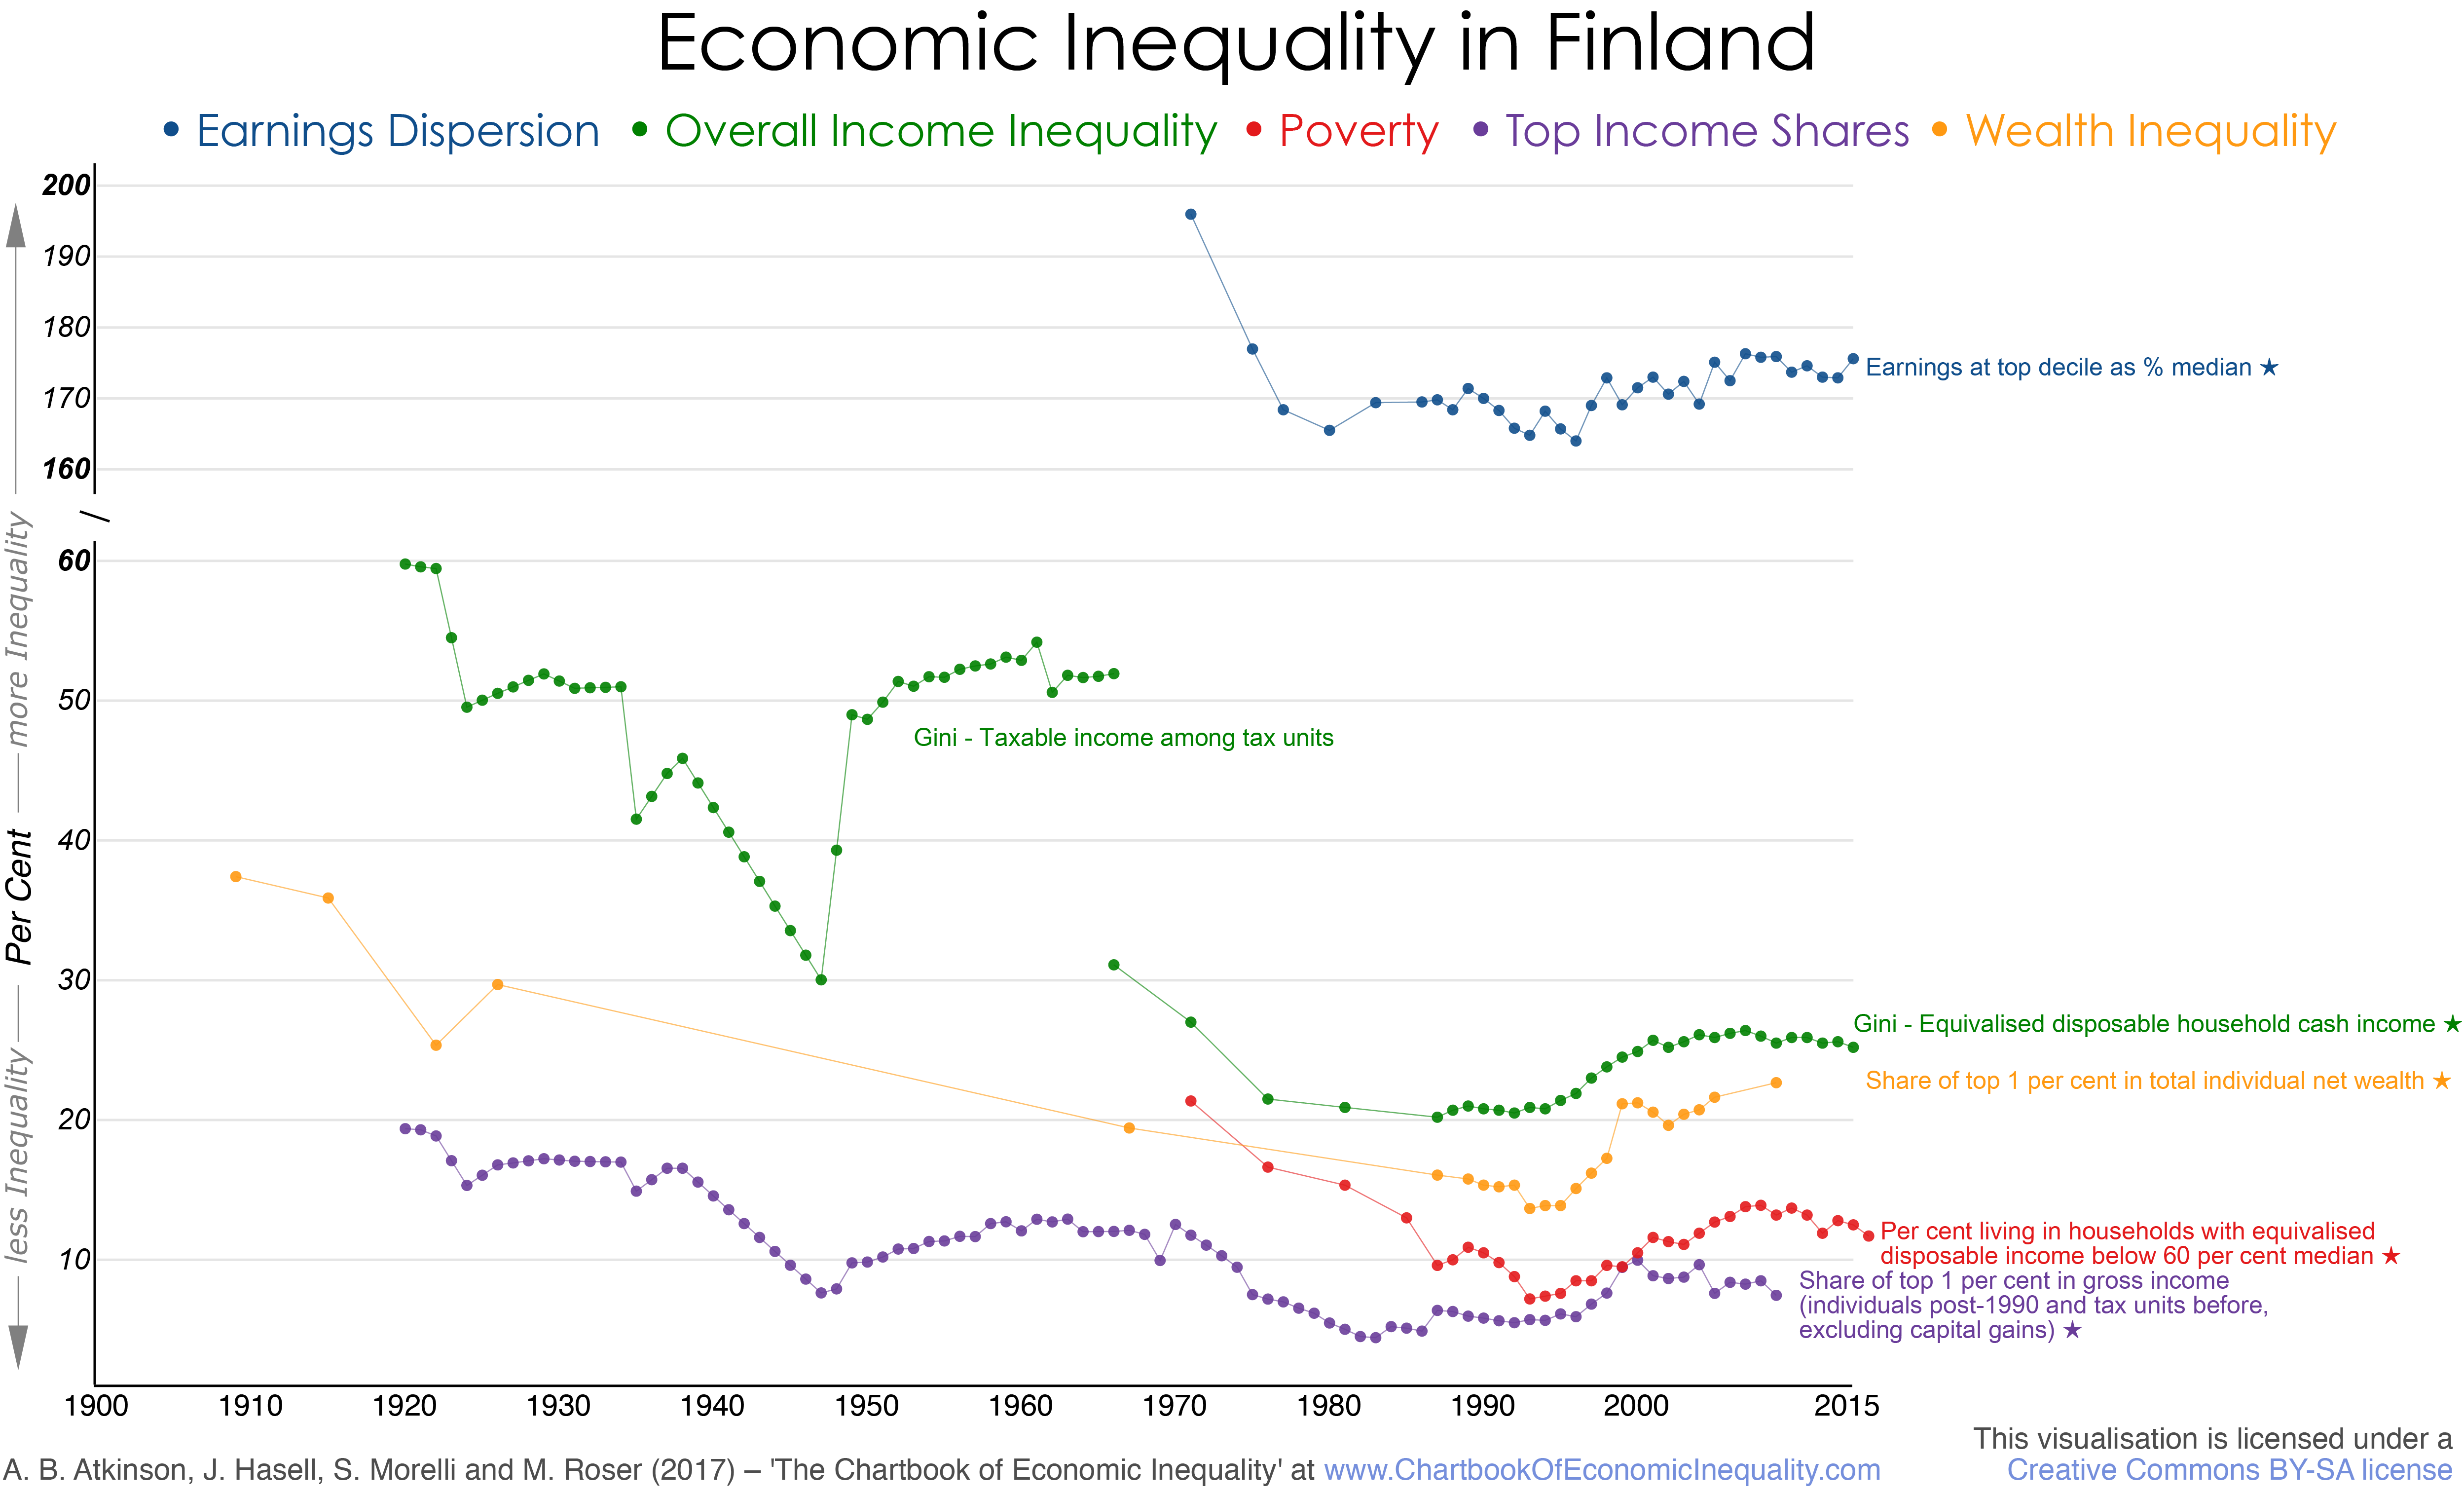
Overall inequality: Series 1: Gini coefficient of equivalised (EU scale) household disposable cash income from 1966 from Statistics Finland – Income and Consumption, Income Distribution Statistics (PX-Web StatFin, Table 4b; accessed 22 February 2017); it should be noted that the figures for 1966-1981, 1987-1992, and from 1993 are not fully comparable and that the figures prior to 2002 use the OECD equivalence scale; earlier series 2 for distribution among tax units based on tax records from 1920 to 1966 from Jäntti et al (2010, Table 8A.1), see also Berglund et al (1998) and Eriksson and Jäntti (1998). From 2011 onwards Statistics Finland uses households’ disposable money income as the main concept (imputed income from owner-occupied dwellings and taxable realized capital gains are excluded).
Top income shares: Share of top 1 per cent in total gross income (individuals post-1990 and tax units before, excluding capital gains) from WID.world based on work of Jäntti et al (2010) based on the Income Distribution Survey, linked at 1990 to the earlier series based on income tax records.
Poverty measures: Percentage of individuals in households with equivalised (modified OECD scale) disposable income below 60 per cent of the median from website of Statistics Finland – Income and Consumption, Income Distribution Statistics (PX-Web StatFin, Table 5a; accessed 22 February 2017), linked backwards at 1990 to estimates by Riihelä, Sullström and Tuomala (2003, Table A.4.1) using OECD equivalence scale.
Dispersion of earnings: Earnings at top decile as percentage of median earnings, from OECD iLibrary, Employment and Labour Market Statistics, Gross earnings decile ratios (accessed 22 February 2017), linked at 1980 to earlier series from Atkinson (2008, Appendix F, Table F.3).
Wealth inequality: Share of top 1 per cent in total individual net wealth from Roine and Waldenström (2015). Figures are based on estate data between 1907 and 1915; wealth tax assessments 1922-67; wealth tax tabulations from 1987-2005 using net marketable wealth.
References:
- Atkinson, A B, 2008, The changing distribution of earnings in OECD countries, Oxford University Press, Oxford.
- Berglund, M, Jäntti, M, Parkatti, L and Sundqvist, C, 1998, “Long-run trends in the distribution of income in Finland 1920-1992”, Åbo Akademi University.
- Eriksson, T and Jäntti, M, 1998, “Modelling the distribution of income and socio-economic variables: Finland 1949-1992”, paper presented at the 25th General Conference of the IARIW, Cambridge.
- Jäntti, M, Riihelä, M, Sullström, R and Tuomala, M, 2010, “Trends in top income shares in Finland”, in A B Atkinson and T Piketty, editors, Top incomes: A global perspective, Oxford University Press, Oxford.
- Riihelä, M, Sullström, R and Tuomala, M, 2003, “On recent trends in economic poverty in Finland”, Tampere Economic Working Paper 23, Department of Economics, University of Tampere.
- Roine, J and Waldenström, D, 2015, “Long run trends in the distribution of income and wealth” in A B Atkinson and F Bourguignon, editors, Handbook of Income Distribution, volume 2, Elsevier, Amsterdam.