Download the database (.xls) – Download the entire Chartbook (.pdf)


Sources and References
Sources:
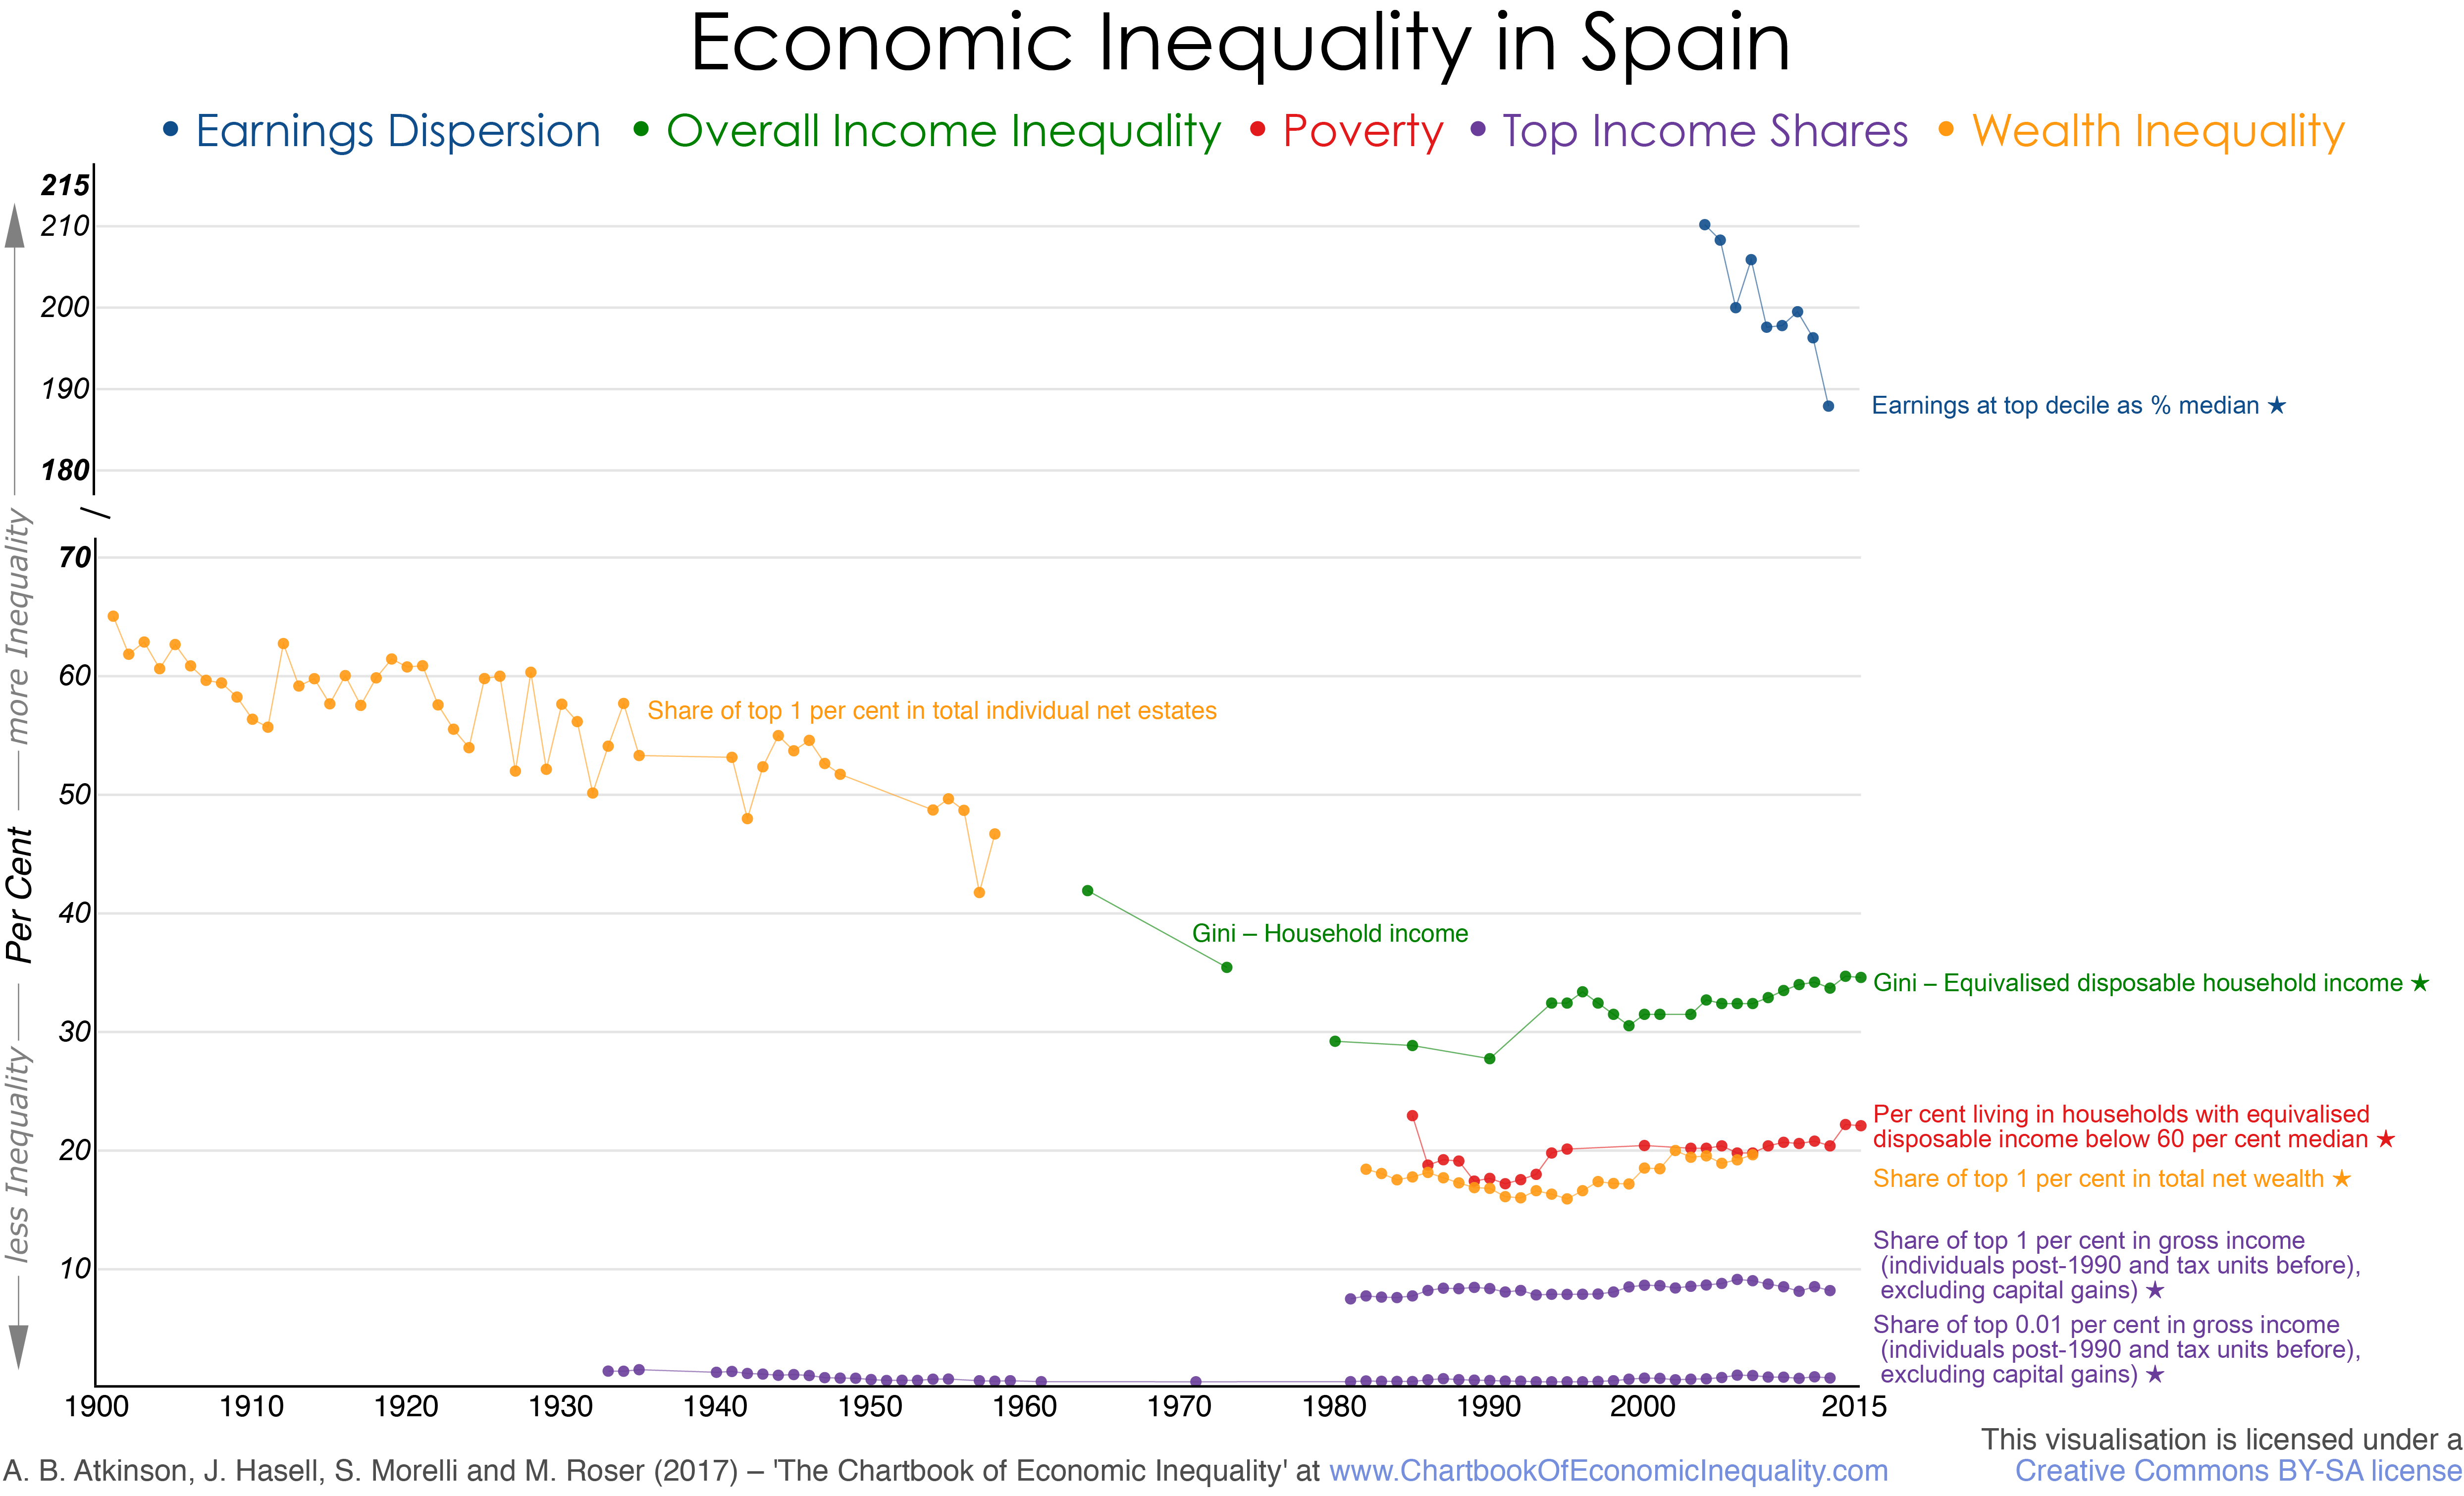
Overall inequality: Series 1 relates to household equivalised disposable income from EU-SILC (ilc_di12 series), Eurostat website, accessed 27 February 2017 (there are breaks in the series in 2000, 2003 and 2007, which have been treated by assuming that there was no change in the intervening year); linked at 1995 to the series related to equivalised (square root scale) disposable household income among individuals from Luxembourg Income Study (LIS) Key Figures website; series 2 relates to household income from Family Budget surveys from United Nations (1981, page 297).
Top income shares: Share of top 1 and 0.01 per cent in total gross income from WID.world (excluding capital gains), based on work of Alvaredo and Saez (2010) updated by the same authors for recent estimates. The series refers to individuals aged 15+ minus married women until 1989 and to individuals aged 15+ from 1990.
Poverty measures: Percentage of individuals living in households with equivalised (EU scale) disposable income less than 60 per cent of the median from EU-SILC (People at risk of poverty after social transfers table), Eurostat website (accessed 27 Feb 2017) (there is a break in the series at 2007, which have been treated by assuming that there was no change in the intervening year); data are linked at 2003 to the series related to those with equivalised (square root scale) disposable income less than 60 per cent of the median from Luxembourg Income Study (LIS) Key Figures; the data are further linked back at 1995 to the series related to those with equivalised (OECD scale) disposable income less than 60 per cent of the median from Cantó, del Rio and Gradin (2003, Tabla 2).
Dispersion of earnings: Earnings at top decile as percentage of median earnings, from OECD iLibrary, Employment and Labour Market Statistics, Gross earnings decile ratios (accessed 22 February 2017).
Wealth inequality: Series 1: Share of top 1 per cent in total individual net wealth including real estate from Alvaredo and Saez (2010, Table 10D.8), based on wealth tax data, updated to 2007; Series 2 share of top 1 per cent in total individual estates from Alvaredo and Artola Blanco, forthcoming, Figure 6. (For estimates based on the investment income method, see Martínez-Toledano, 2016.)
References:
- Alvaredo, F and Artola Blanco, M, forthcoming, “Wealth concentration in Spain in European context 1900-2015: Local versus global forces”, mimeo.
- Alvaredo, F and Saez, E, 2010, “Income and wealth concentration in Spain on a historical and fiscal perspective” in A B Atkinson and T Piketty, editors, Top incomes: A global perspective, Oxford University Press, Oxford.
- Cantó, O, del Rio, C, and Gradin, C, 2003, “La evolucion de la pobreza estática y dynámica en España en el periodo 1985-1995”, Hacienda Pública Española, vol 167; 87-119.
- Escribano, C, 1990, “Evolucion de la pobreza y la desigualdad en España, 1973-1987”, Información Comercial Española, Octobre: 81-108.
- Martínez-Toledano, Clara, 2016, “The distribution of wealth in Spain: Evidence from capitalized income tax data”, mimeo.
- United Nations, 1981, A survey of national sources of income distribution statistics, Statistics Papers, series M, number 79, United Nations, New York.