Download the database (.xls) – Download the entire Chartbook (.pdf)


Sources and References
Sources:
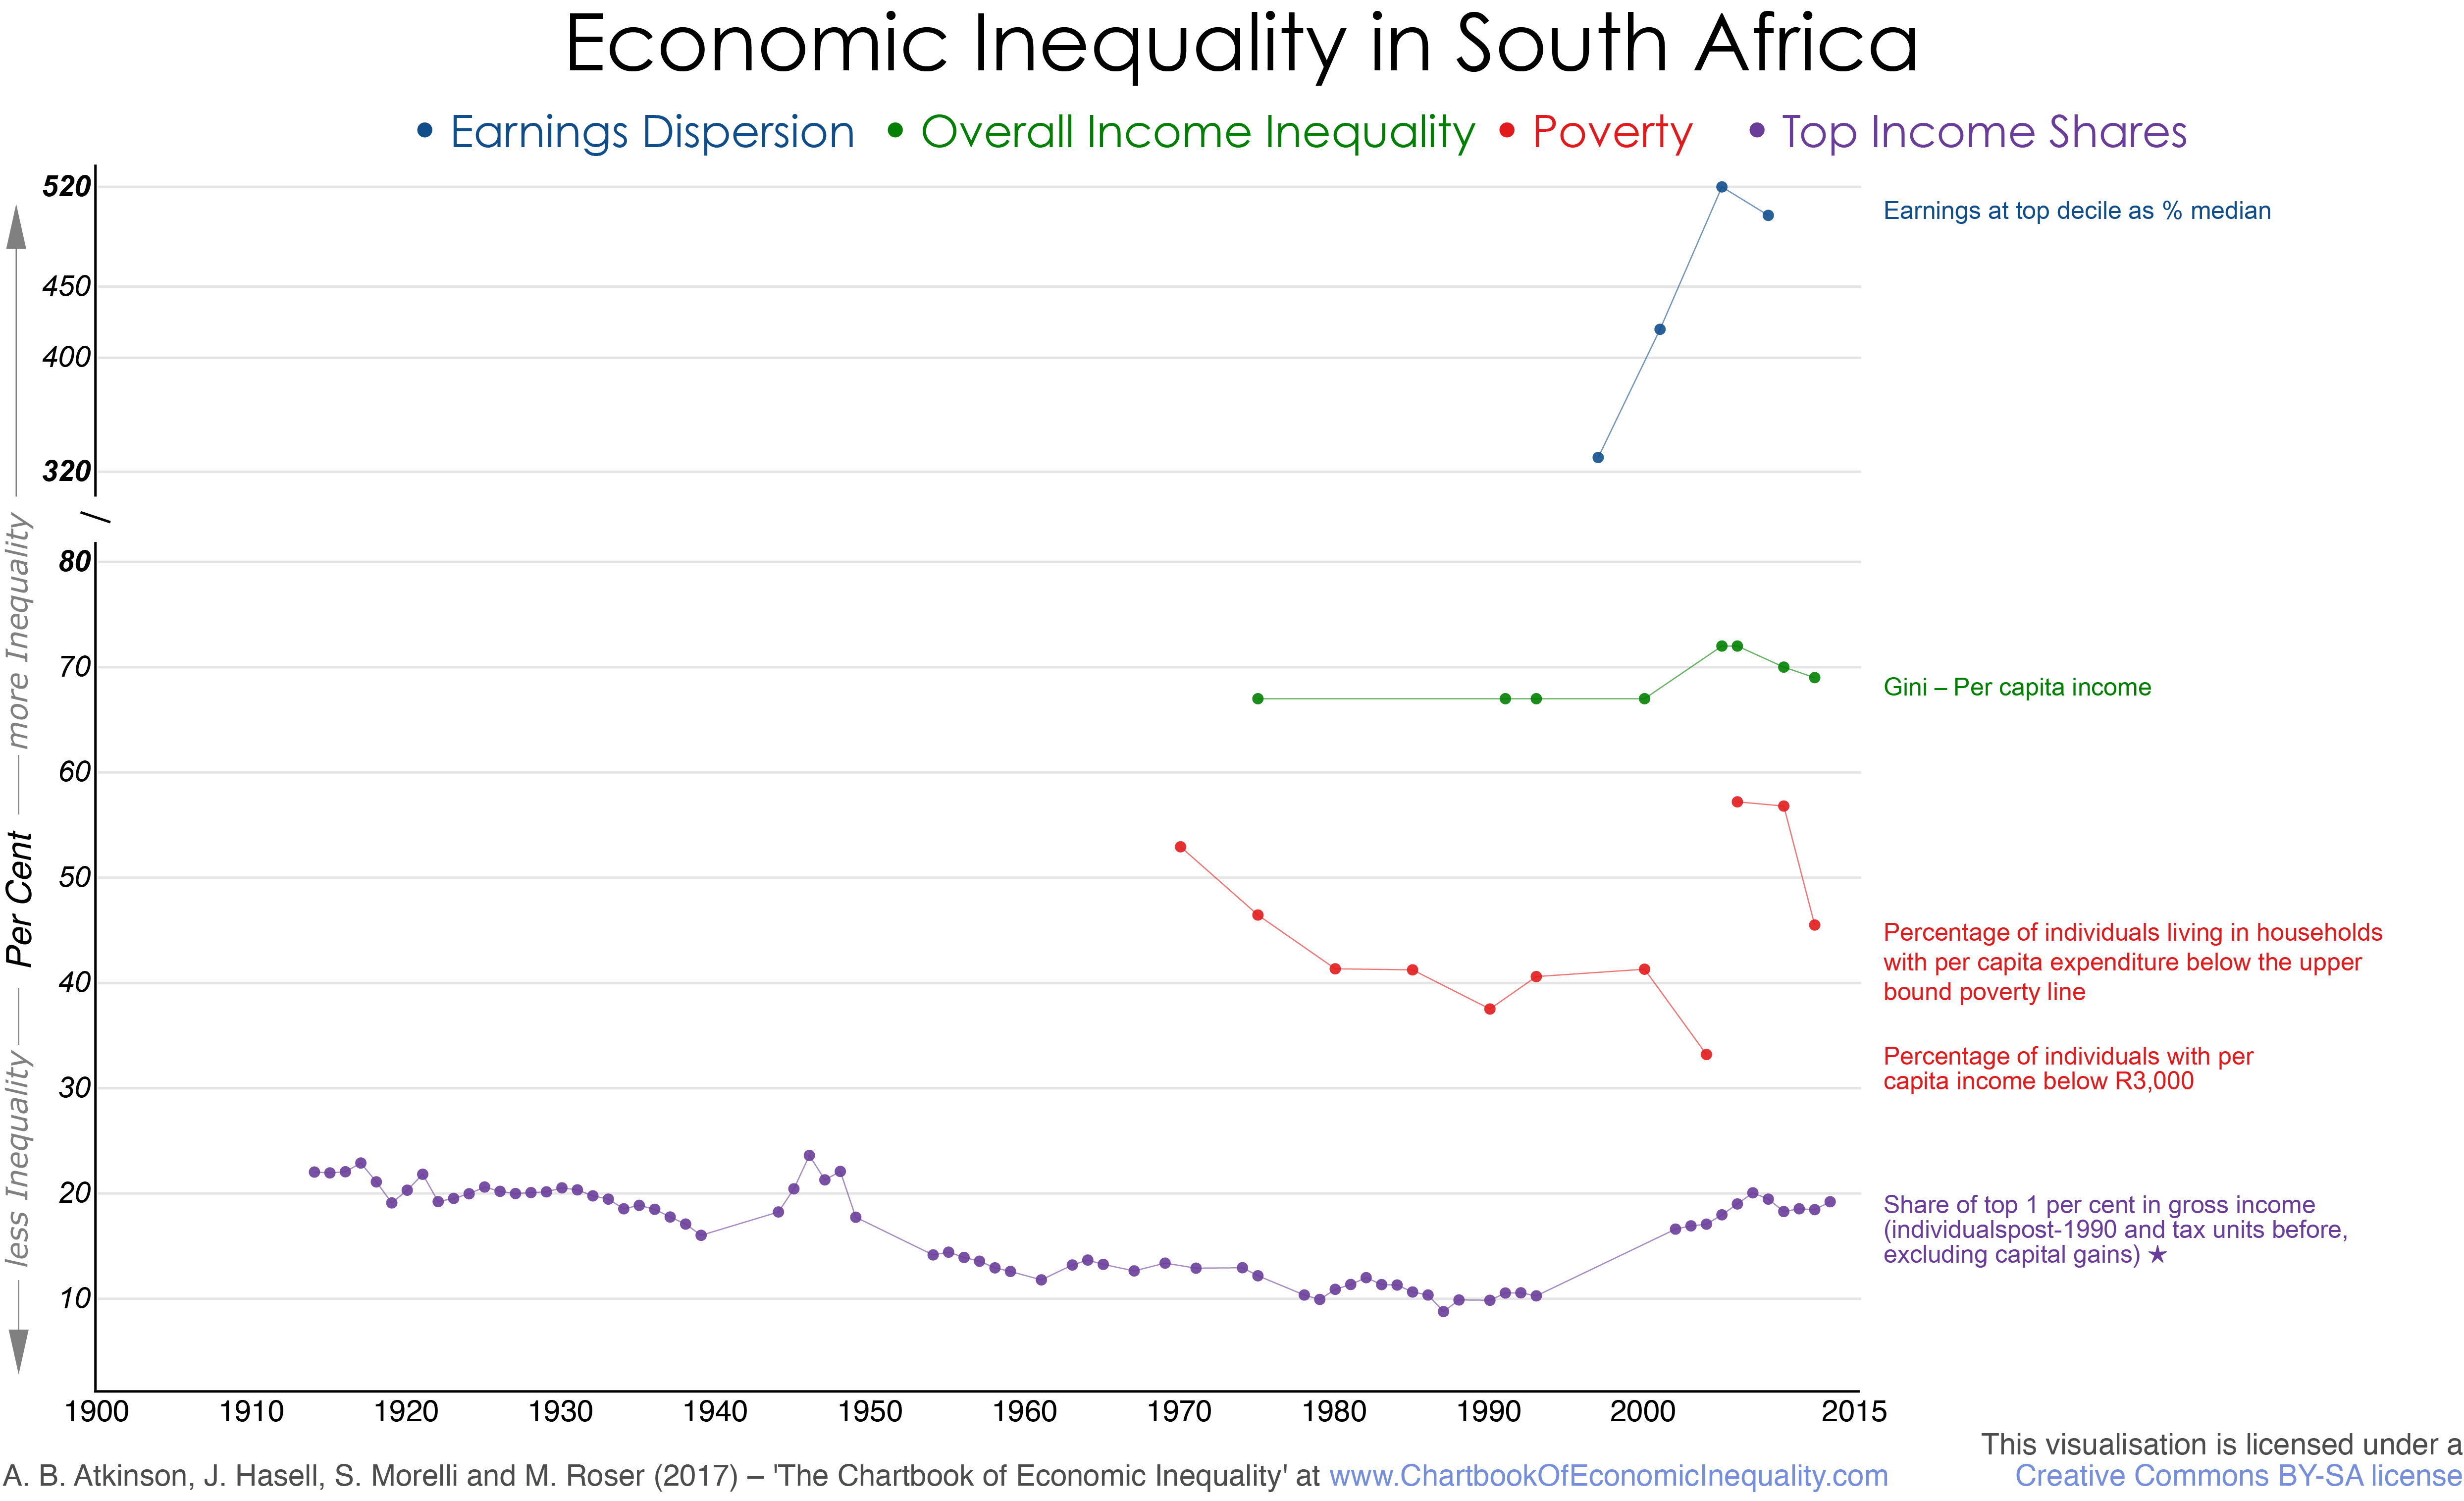
Overall inequality: Gini coefficient of per capita income from Statistics South Africa, 2014, Table 5, linked at 2005/2006 to series from 1993 from Leibbrandt et al (2010a, Table 5.17), linked at 1991/1993 to estimates for 1975, 1991 and 1996 of Whiteford and van Seventer (2000).
Top income shares: Shares of top 1 per cent in total gross income from WID.world (excluding capital gains), based on work of Alvaredo and Atkinson (2011) updated by the same authors for latest figures. It is worth noting that the top shares series have a break in 1990. Data refer to married couple and single adults before 1990 and to individuals from 1990.
Poverty measures: There is no official poverty line. A variety of poverty standards have been employed – see Budlender, Leibbrandt and Woolard (2015). Series 1 taken from Statistics South Africa (2014, Table 3) based on the Income and Expenditure Survey (IES) and Living Conditions Survey (LCS), relating to percentage of individuals living in households with per capita expenditure below the “upper bound” poverty line. Series 2 relates to the percentage of individuals (all races) living in households with per capita income below R 3,000 (at 2000 prices) by Leibbrandt et al (2010, Table 1.3); linked at 2000 back to 1970 using data from van der Berg and Louw (2004, Table 5) (average of pessimistic and optimistic estimates taken for 2000).
Dispersion of earnings: Earnings at top decile as percentage of median earning from Leibbrandt et al (2010a, Table 5.19).
Wealth inequality: No suitable data were found.
References:
- Alvaredo, F and A B Atkinson (2011). Colonial Rule, Apartheid and Natural Resources: Top Incomes in South Africa 1903-2007. CEPR Discussion Paper 8155
- Borat, H and Kanbur, R, editors, 2006, Poverty and policy in post-apartheid South Africa, Human Sciences Research Council, Cape Town.
- Budlender, J, Leibbrandt, M and Woolard, I, 2015, “South African poverty lines: a review and two new money-metric thresholds”, Southern Africa Labour and Development Research Unit Working Paper Number 151, University of Cape Town, Cape Town.
- Lachmann, and Bercuson, K, 1992, editors, Economic policies for a new South Africa, IMF Occasional Paper No 91, Washington, D.C.
- Leibbrandt, M, Poswell, L, Naidoo, M, Welch, M, and Woolard, I, 2006, “Measuring recent changes in South African inequality and poverty using 1996 and 2001 Census data”, in Borat and Kanbur (2006).
- Leibbrandt, M, Woolard, I, Finn, A, and Argent, J, 2010, “Trends in South African income distribution and poverty since the fall of apartheid”, OECD Social, Employment and Migration Working Papers 101, OECD, Paris.
- Leibbrandt, M, Woolard, I, McEwen, H, and Koep, C, 2010a, “Better employment to reduce inequality further in South Africa” in Tackling inequalities in Brazil, China, India and South Africa, OECD, Paris.
- Statistics South Africa, 2014, Poverty trends in South Africa, Statistics South Africa, Pretoria.
- Van der Berg, S and Louw, M, 2004, “Changing patterns of South African income distribution: Towards time series estimates of distribution and poverty”, South African Journal of Economics, vol 72: 546-572.
- Whiteford, A C and van Seventer, D E, 2000, “South Africa’s changing income distribution in the 1990s”, Studies in Economics and Econometrics, vol 24: 7-30.