Download the database (.xls) – Download the entire Chartbook (.pdf)


Sources and References
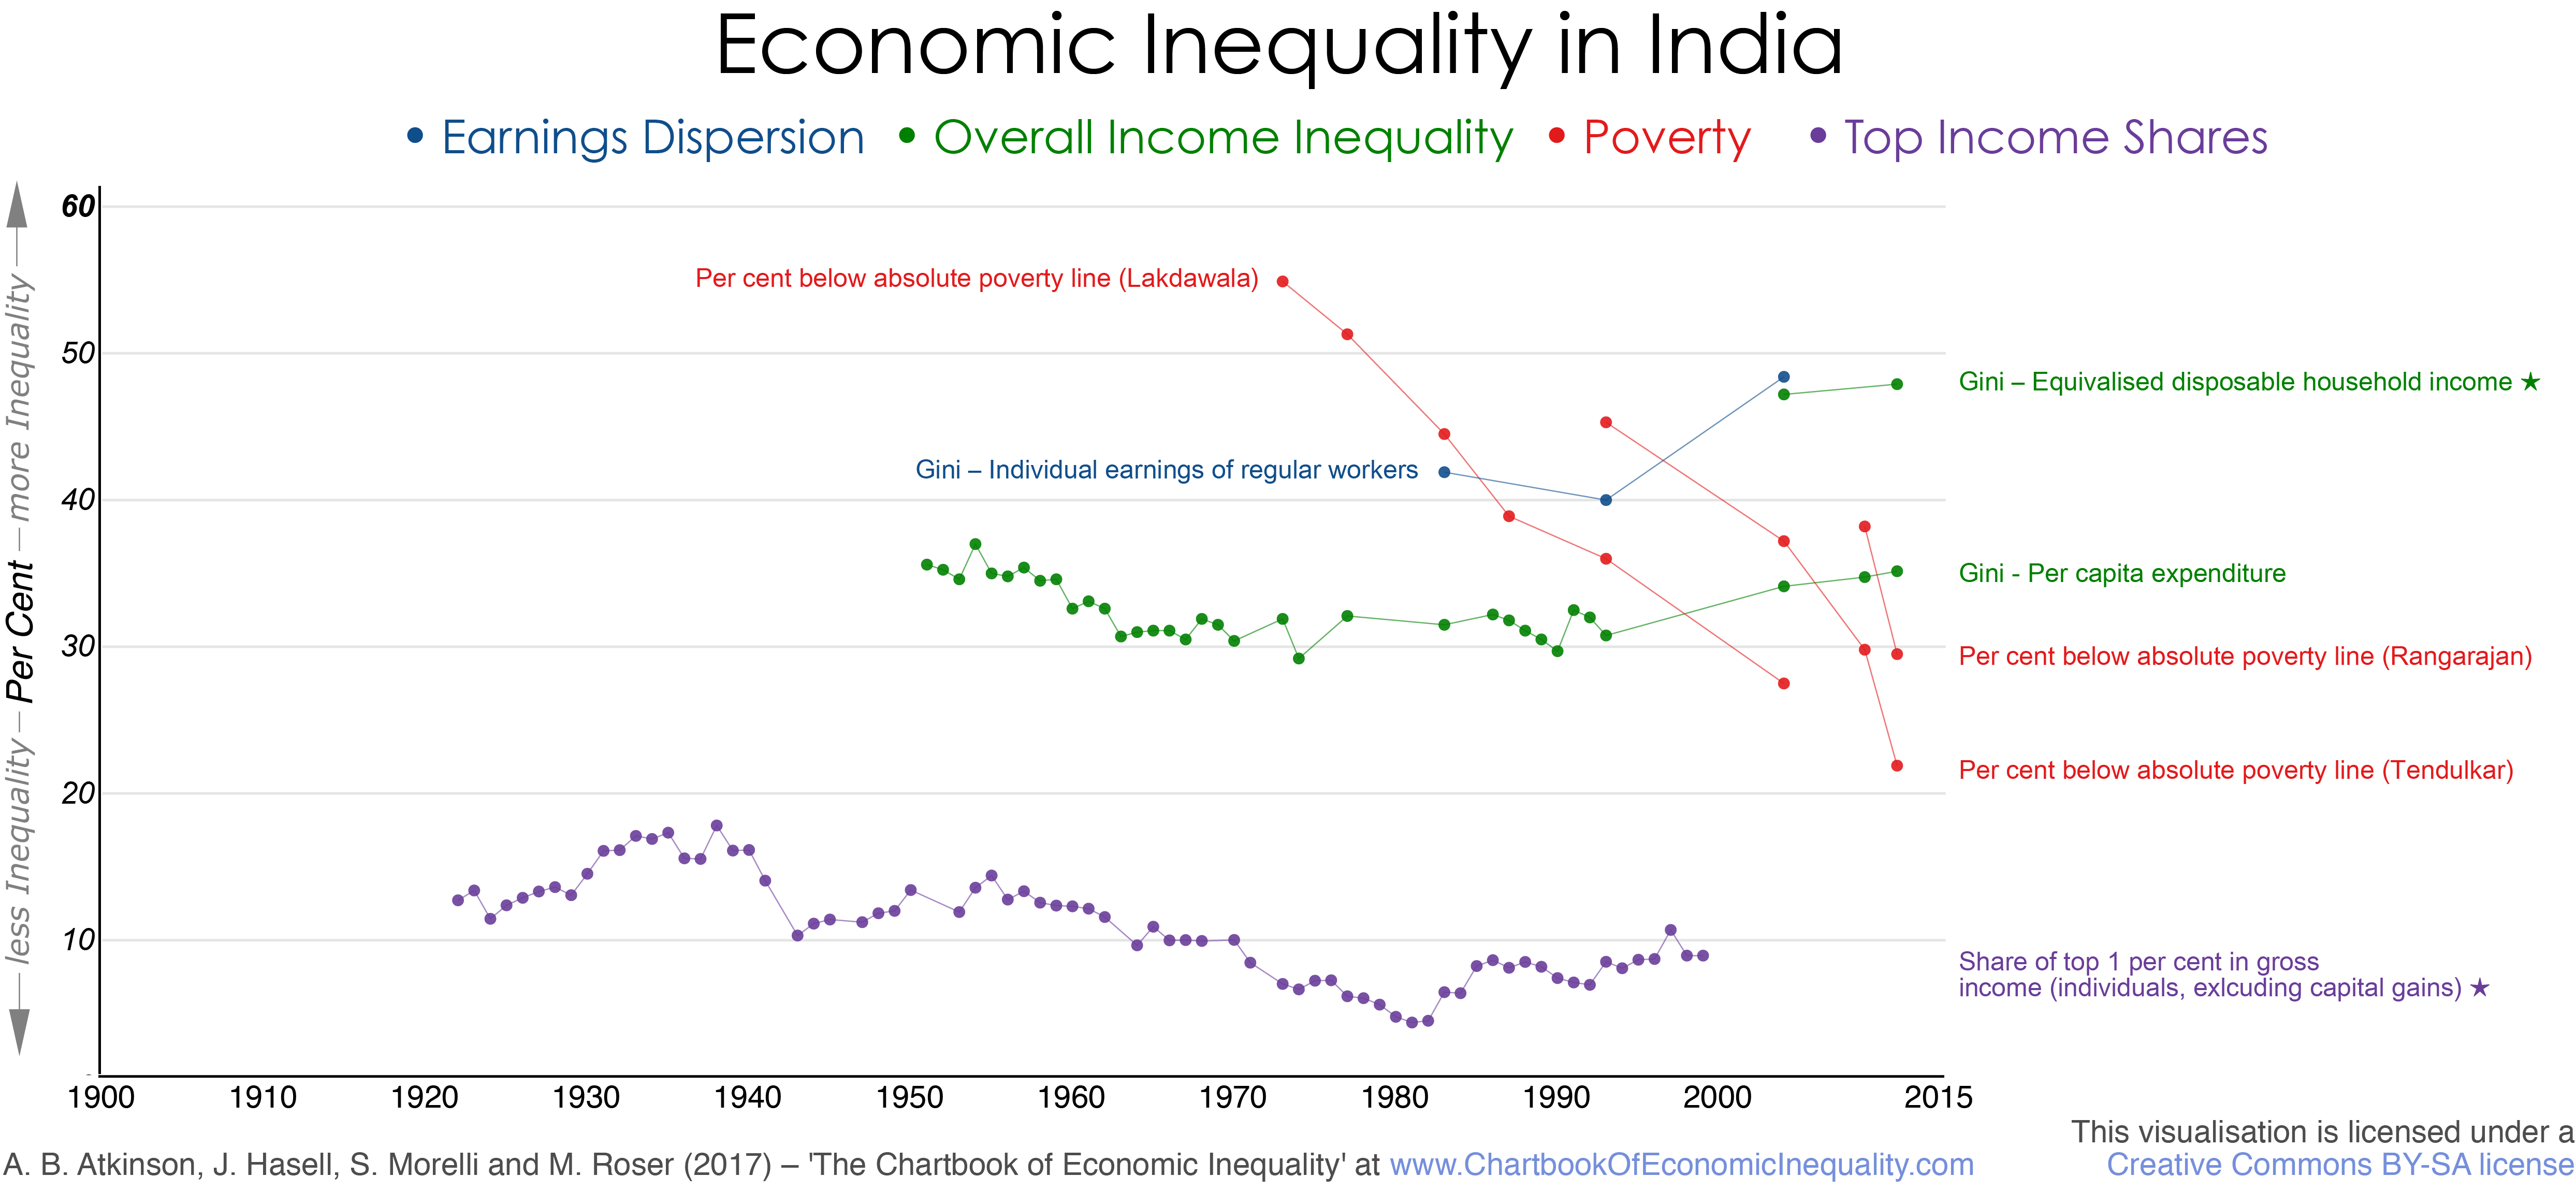
Sources:
Overall inequality: Series 1: Gini coefficient for equivalised disposable household income from LIS Key Figures (see Vanneman and Dubey, 2013), accessed 21 February 2017; Series 2: Gini coefficient for per capita expenditure from World Bank India Database and World Bank 2016 database as listed in World Income Inequality Database version 3.4, January 2017 (accessed 28 February 2017), all India data. Figures for 1952, 1953 and 1956 are averages of the two available estimates. The 1993 figure is calculated as weighted average of the urban and rural estimates, using the weighting implied by the 1992 figures; similarly for the 2004 and 2009 observations, using the weighting implied by the 2011 figures.
Top income shares: Share of top 1 per cent in total gross income (individuals, excluding capital gains) from WID.world, based on work of Banerjee and Piketty (2010).
Poverty measures: Three series from Rangarajan (2014): series 1 (Expert Group Rangarajan) from Table 4.7; series 2 (Expert Group Tendulkar) from Table 2.2; and series 3 (Expert Group Lakdawala) from Table 2.1. The changes in methodology over time were implemented in order to better capture the changes in the composition and price of the consumption basket of the poor as well as the changing norms and expectations about living conditions (see More and Singh, 2014 for an account).
Dispersion of earnings: Gini coefficient for daily earnings of regular workers from Majumdar (2010, Table 4.4).
Wealth inequality: No suitable data were found.
References:
- Asian Development Bank, 2007, Key Indicators 2007, Asian Development Bank, Manila.
- Banerjee, A and Piketty, T, 2010, “Top Indian incomes, 1922-2000” in A B Atkinson and T Piketty, editors, Top incomes: A global perspective, Oxford University Press, Oxford.
- Government of India, Planning Commission, 2013, Poverty Estimates for 2011-2012, Government of India, Press information Bureau.
- Majumdar, D, 2010, “Decreasing poverty and increasing inequality in India” in Tackling inequalities in Brazil, China, India and South Africa, OECD, Paris.
- More, S. and Singh, N., 2014: Poverty in India: concepts,measurement and status, mimeo.
- Rangarajan, C, 2014, Report of the Expert Group to review the methodology for measurement of poverty, Planning Commission, New Delhi.
- Vanneman, R and Dubey, A, 2013, “Horizontal and vertical inequalities in India” in J C Gornick and M Jäntti, editors, Income inequality: Economic disparities and the middle class in affluent countries, Stanford University Press, Stanford.