Download the database (.xls) – Download the entire Chartbook (.pdf)


Sources and References
Sources:
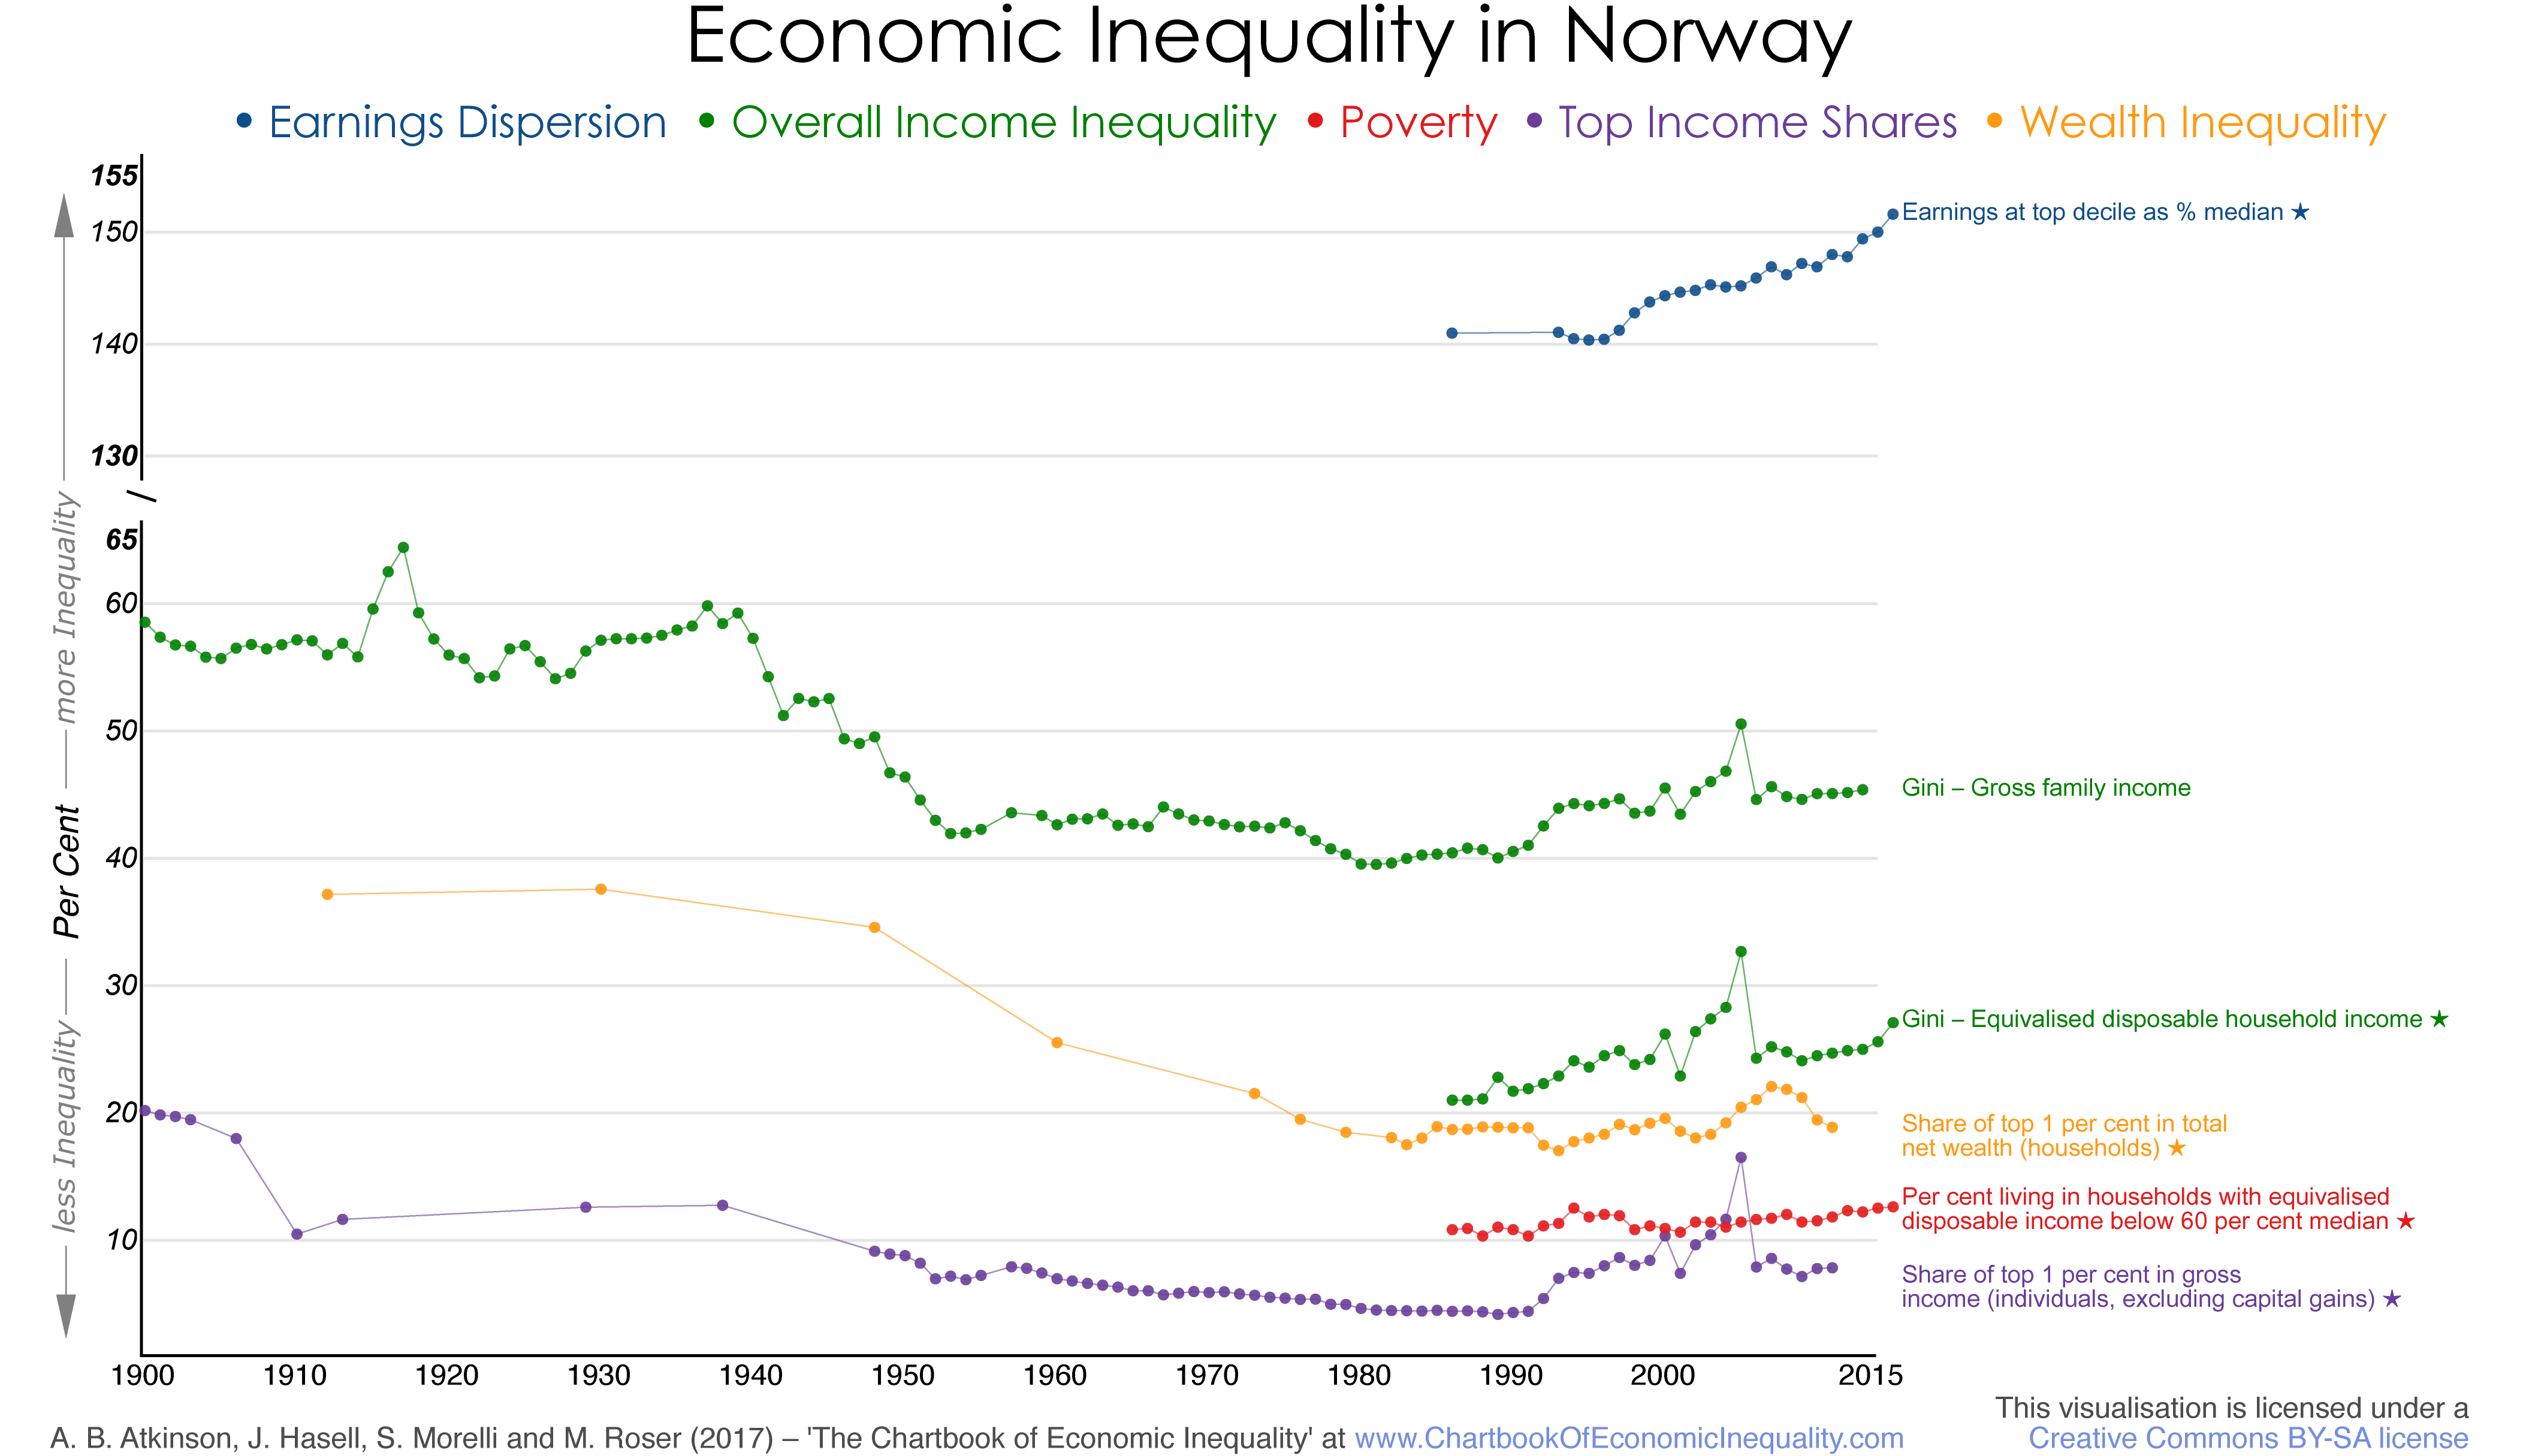
Overall inequality: Series 1: Gini coefficient of gross family income not equivalised from Aaberge, Atkinson and Modalsli (2016, Table A1, average of upper and lower bounds; see also Table A5); Series 2: Gini coefficient of equivalised (EU scale) disposable household income from StatBank within the website of Statistics Norway, Income and Wealth Statistics for Households, Income, Table 07756 (Measures of income dispersion), total population.
Top income shares: Share of top 1 in total gross income from WID.world (individuals, excluding capital gains), based on work of Aaberge and Atkinson (2010) updated by Aaberge, Atkinson and Modalsli (2013).
Poverty measures: Percentage of individuals in households with equivalised (EU-scale) disposable income below 60 per cent of the contemporary median (including student households), from StatBank within the website of Statistics Norway, Income and Wealth Statistics for Households, Income, Table 06801 (Percentage of people in households with annual after-tax income below different distances to the median), linked backwards at 1996 to earlier series from Income Distribution Survey (Inntekts- og formuesundersøkelsen for husholdninger – IF) 2005, Table 5, and linked at 1986 to earlier series for 50 per cent of the median.
Dispersion of earnings: Earnings at top decile as percentage of median earnings, from OECD iLibrary, Employment and Labour Market Statistics, Gross earnings decile ratios (accessed 22 February 2017); linked at 2002 to a series of the authors’ own calculations extrapolating from income shares data in Atkinson (2008, Appendix N, Table N.3).
Wealth inequality: Share of top 1 per cent of households in total personal net wealth from Roine and Waldenström (2015), downloaded from Waldenström’s webpage, drawing from Ohlsson, Roine and Waldenström (2008, Table 1).
References:
- Aaberge, R and Atkinson, A B, 2010, “Top incomes in Norway” in A B Atkinson and T Piketty, editors, Top incomes: A global perspective, Oxford University Press, Oxford.
- Aaberge, R, Atkinson, A B and Modalsli, J, 2013, “The ins and outs of top income mobility”, Statistics Norway Research Department Discussion Paper no 762.
- Aaberge, R, Atkinson, A B and Modalsli, J, 2016, “The long-run distribution of income in Norway”, Statistics Norway.
- Atkinson, A B, 2008, The changing distribution of earnings in OECD countries, Oxford University Press, Oxford.
- Bojer, H, 1987, “Personlig inntektsfordeling i Norge 1970-1984, Tidsskrift for Sammfunnsforskning, vol 28: 247-258.
- Ohlsson, H, Roine, J and Waldenström, D, 2008, “Long-run changes in the concentration of wealth: An overview of recent findings”, in J B Davies, editor, Personal wealth from a global perspective, Oxford University Press, Oxford.
- Roine, J and Waldenström, D, 2015, “Long run trends in the distribution of income and wealth” in A B Atkinson and F Bourguignon, editors, Handbook of Income Distribution, volume 2, Elsevier, Amsterdam.