Download the database (.xls) – Download the entire Chartbook (.pdf)
Sources and References
Sources:
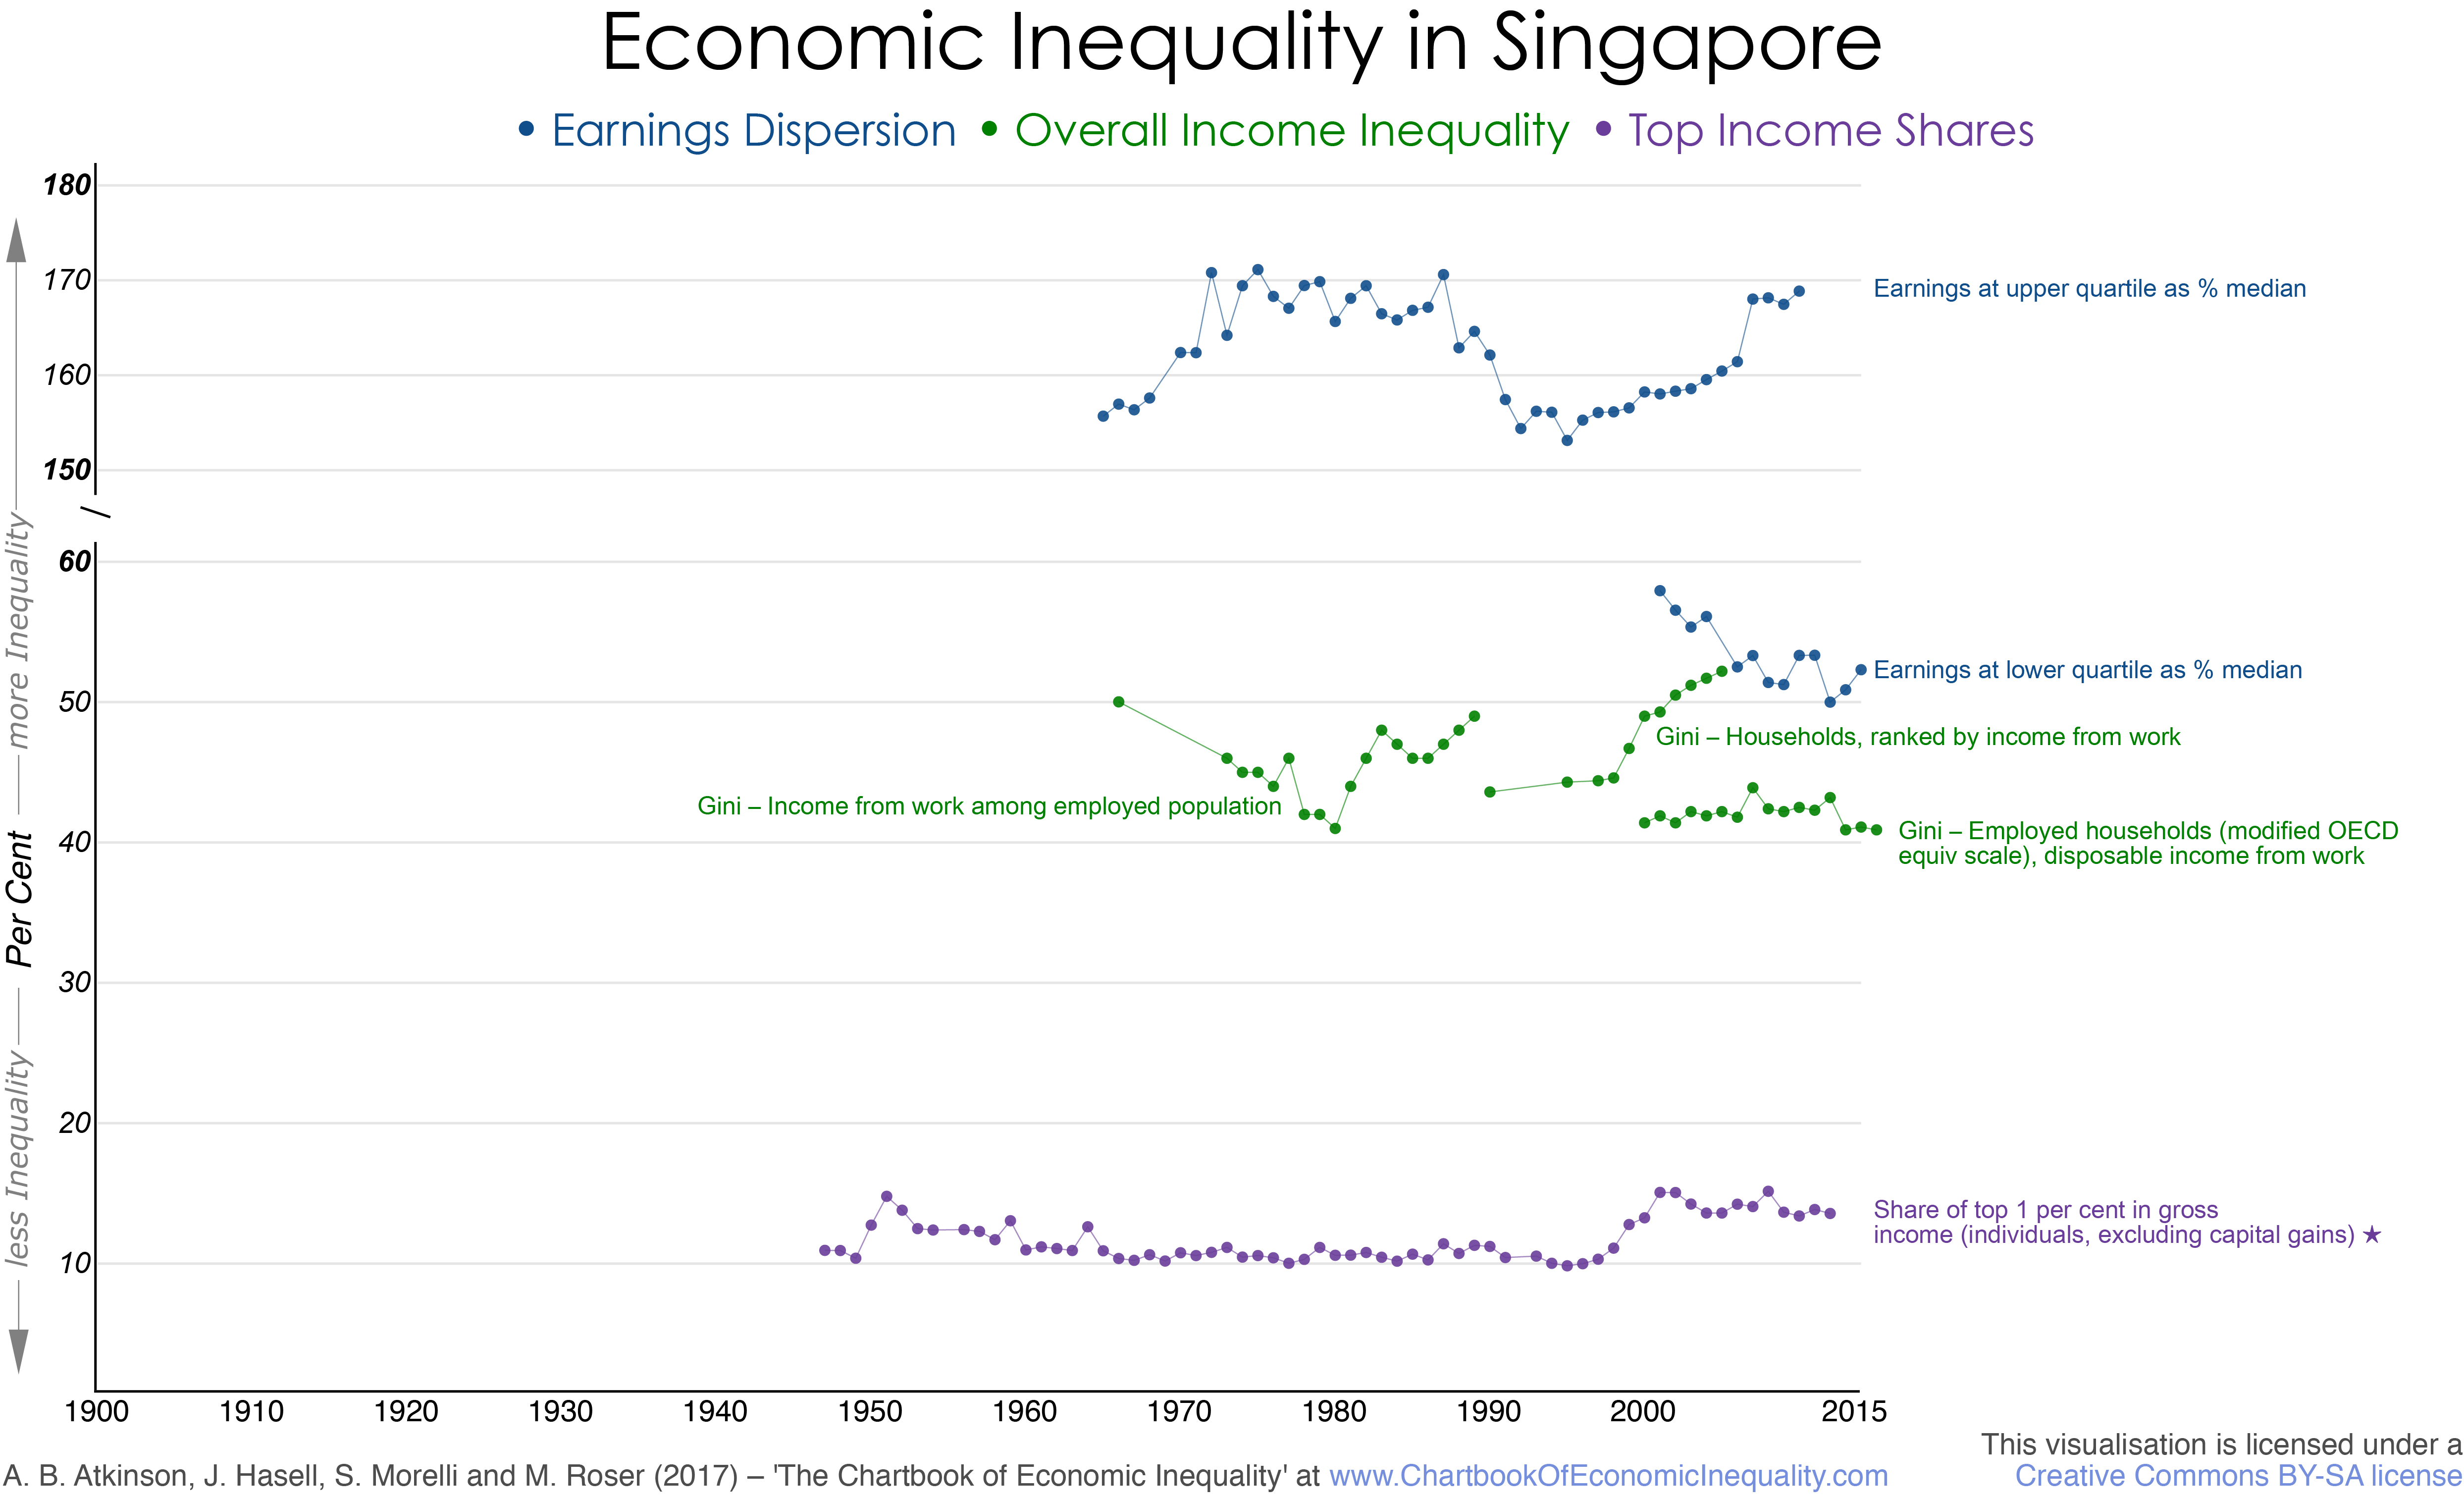
Overall inequality: Series 1 household income from work per household member (based on modified OECD scale) including employer Central Provident Fund -CPF- contributions and after accounting for government transfers and taxes, from Statistics Singapore, Household Income, Table 15.Series 2 per capita monthly income from work for all households from Krongkaew and Ragayah (2006, Table 2); Series 3 per capita monthly income from work for employed population only from Krongkaew and Ragayah (2006, Table 2); linked at 1974 to Rao (1988) cited in the same source.
Top income shares: Shares of top 1 per cent in total gross income from WID.world (individuals, excluding capital gains), based on work of Atkinson (2010) and updated by the author using the Annual Reports of the Inland Revenue Authority, Appendix 5. The data from tax income refer to ‘year of assessment”. Estimates for 1980 to 1986 are based on 12 month rather than 24 month assessments.
Poverty measures: No suitable data were found.
Dispersion of earnings: Earnings at upper quintile as percentage of median from Central Pension Fund earnings data, as described in Atkinson (2010), updated for 2010 from Yearbook of Singapore Statistics, Table 4.10. This source no longer contains earnings figures. Earnings at bottom quintile from Statistics Singapore, Labour, Employment, Wages and Industry Tables; the source notes that the year-on-year changes tend to be volatile.
Wealth inequality: No suitable data were found.
References:
- Atkinson, A B, 2010, “Top incomes in a rapidly growing economy: Singapore”, in A B Atkinson and T Piketty, editors, Top incomes: A global perspective, Oxford University Press.
- Krongkaew, Medhi and Ragayah, Haji Mat Zin, 2006, “Income distribution and sustainable economic development in East Asia: A comparative analysis”.
- Rao, V.V. B, 1988. ‘Income Distribution in East Asian Developing Countries’, Asian-Pacific Economic Literature, vol. 2, no. 1, March, pp. 26-45.
- Singapore Department of Statistics, 2013, Key household income trends, 2012, Occasional Paper on income statistics.


